Egan-Jones CLO* Summary Report (May 2023)
Egan-Jones CLO* Summary Report (May 2023)
*Egan-Jones' ratings in this report are not issued under an NRSRO license
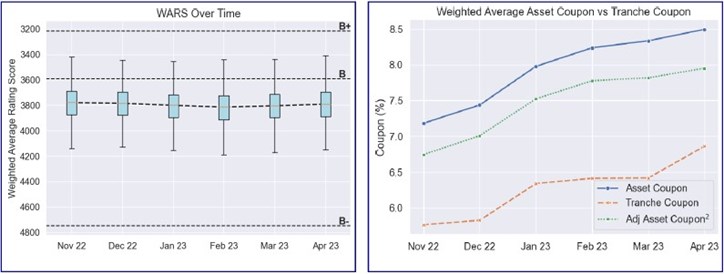
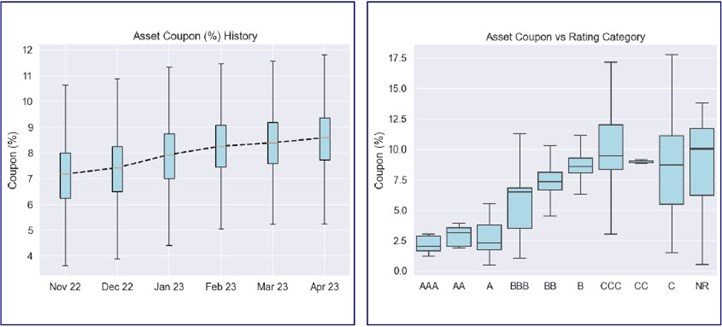
Still stressed – Many outcomes can be drawn from this month’s results. The WARS has been stable (see the left chart below) and funding costs have increased faster than asset coupons (as reflected in the right chart below). Section II-B shows average tranche coupons over time; the coupons for the lower-level tranches appear to have increased fastest. CCC+ and lower assets (reflected in the first chart of the I-D section) have been fairly stable and appear to have decreased slightly. Our conclusion is that the much-discussed concern regarding portfolio quality has not yet manifested. Note: Coverage in this report expanded as compared to the April report. 405 more CLOs were added. The new CLOs contribute to minimal shifts in outcomes.
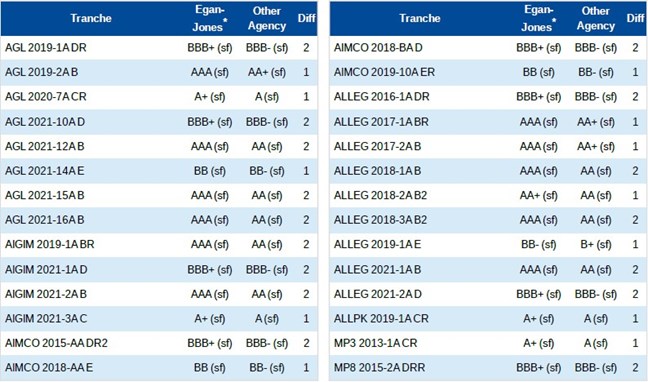
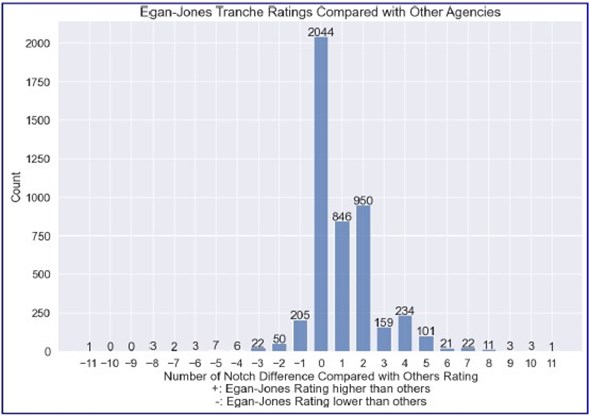
Currently, Egan-Jones tends to have a more positive view of CLO credit quality as compared to other credit rating agencies, as demonstrated in the table below.
I. Deal Key Metrics Summary
As of April 2023, Egan-Jones rated 1357 CLO deals. We collected and calculated available deal level, tranche level and asset level key metrics such as deal weighted average rating factor and tranche subordinations, compared with prior period(s) analysis results and summarized highlights below.
I-A. Weighted Average Rating Score
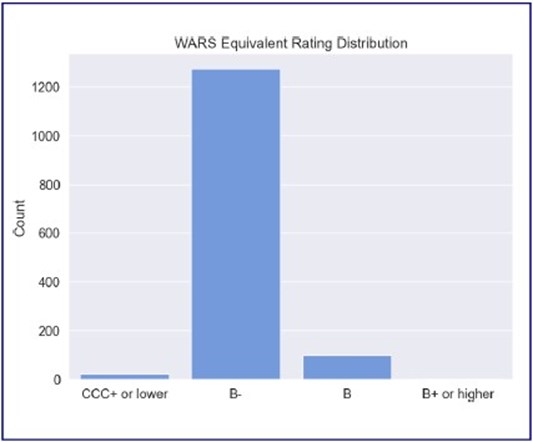
Egan-Jones collected the weighted average rating score (WARS)³ of covered CLO deals. The 25th, 50th, and 75th percentiles of the WARS value were 3696, 3790, and 3890, respectively..
I-B. Diversity Score
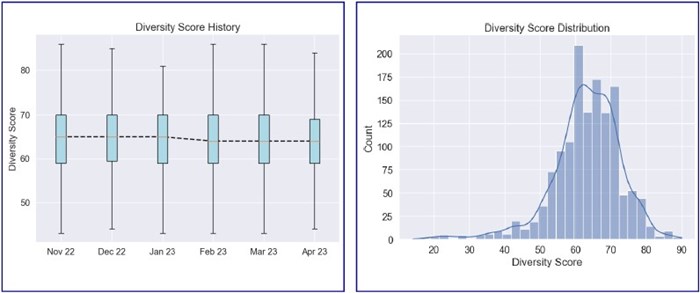
Egan-Jones collected the Diversity Score (DS)⁴ of covered CLO deals. The 25th, 50th, and 75th percentiles of the DS value were 59, 64, and 69, respectively. Egan-Jones calculated and compared the monthly average value of DS data from November 2022 to this month. The mean value of DS has decreased over the observed period, which indicates the diversity level of the portfolios might be decreasing.
I-C. Super Senior Tranches Subordination
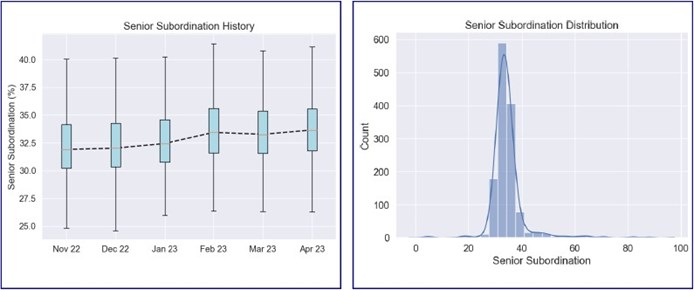
Egan-Jones collected the senior tranches subordination⁵ (%) (STS) of covered CLO deals. The 25th, 50th, and 75th percentiles of the STS value were 31.8, 33.7, and 35.5, respectively. Egan-Jones calculated and compared the monthly average value of STS data from November 2022 to this month. The mean value of STS has increased over the observed period, which indicates the average senior tranche subordination might be increasing.
I-D. CCC+ or Lower Rating Percentage
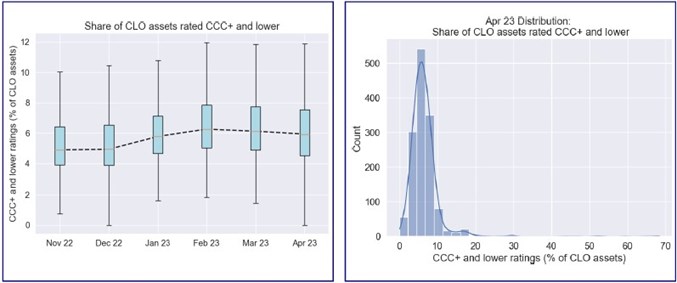
Egan-Jones collected the CCC+ and Lower Rated Asset Percentage (%) (CLRA) of covered CLO deals. The 25th, 50th, and 75th percentiles of the CLRA value were 4.5, 5.9, and 7.5, respectively. Egan-Jones calculated and compared the monthly average value of CLRA data from November 2022 to this month. The mean value of CLRA has increased over the observed period, which indicates the percentage of lower rated assets might be increasing.
I-E. CLO Leverage Summary
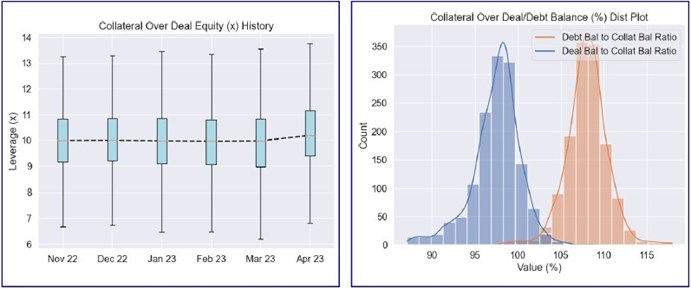
Note: Deal balance is the sum of current balance of all deal tranches; Debt balance is the sum of current balance of all debt tranches.
Egan-Jones reviewed various liability / asset metrics. The 25th, 50th, and 75th percentiles of the total deal balance to collateral balance (total current tranches balance / current collateral balance) were 96.0%, 98.0%, and 99.0%, respectively. The 25th, 50th, and 75th percentiles of the debt balance to collateral balance (current non-equity tranches balance / current collateral balance) were 107.0%, 108.0%, and 109.0%, respectively.
II. Tranche Key Metrics Summary
II-A. Tranche Subordination Analysis
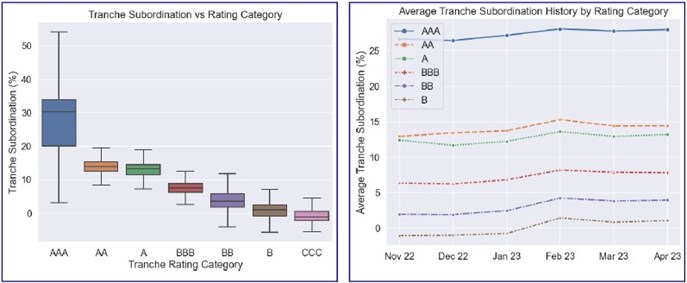
The average subordination levels (defaulted assets at market value) of senior tranches and mezzanine tranches tranches were 34.6% and 12.4%, respectively. The 25th, 50th, and 75th percentiles of senior tranche subordination levels (defaulted assets at market value) were 32.0%, 33.8%, and 35.6%, respectively. The 25th, 50th, and 75th percentiles of mezzanine tranche subordination levels (defaulted assets at market value) were 4.9%, 11.9%, and 19.0%, respectively.
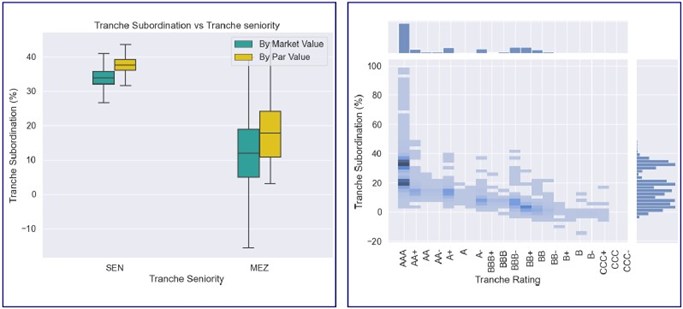

The mean, 25th, 50th, and 75th percentiles of the available subordination of each rating category (includes +/-) can be found in table above.
II-B. Tranche Coupon Analysis
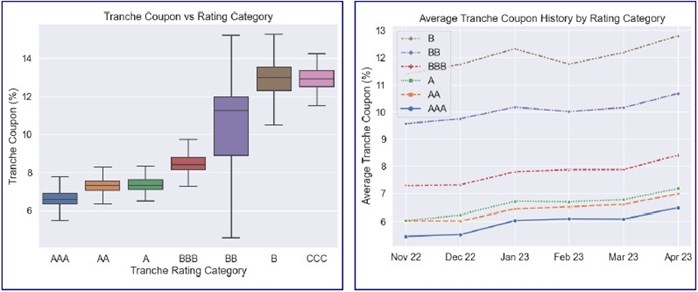
The average coupon of senior tranches and mezzanine tranches are 6.1% and 8.4%, respectively. The 25th, 50th, and 75th percentiles of senior tranche coupon are 6.2%, 6.4%, and 6.5%, respectively. The 25th, 50th, and 75th percentiles of mezzanine tranche coupon are 7.0%, 7.7%, and 10.2%, respectively.
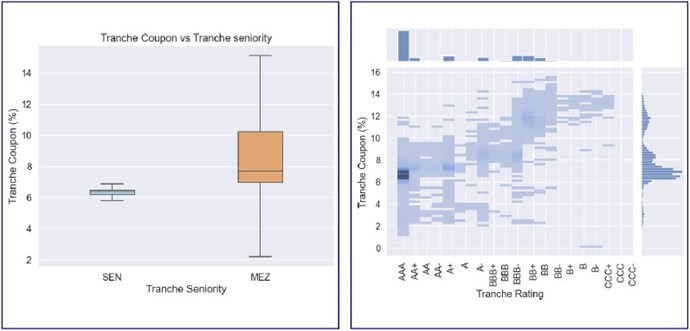

The mean, 25th, 50th, and 75th percentiles of the available coupon of each rating category (includes +/-) can be found in the table above.
II-C. Tranche Spread Analysis
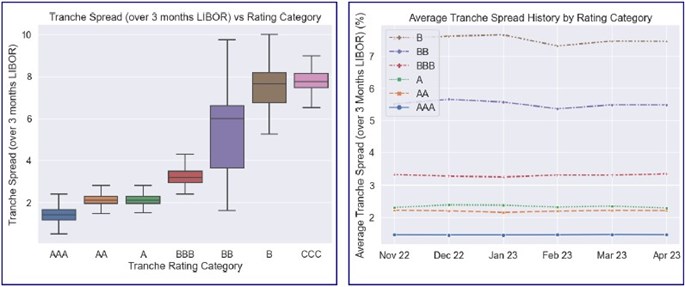
The average spread (over 3 months LIBOR) of senior tranches and mezzanine tranches are 1.2% and 3.4%, respectively. The 25th, 50th, and 75th percentiles of senior tranche spread (over 3 months LIBOR) are 1.0%, 1.1%, and 1.2%, respectively. The 25th, 50th, and 75th percentiles of mezzanine tranche spread (over 3 months LIBOR) are 1.8%, 2.6%, and 5.3%, respectively.
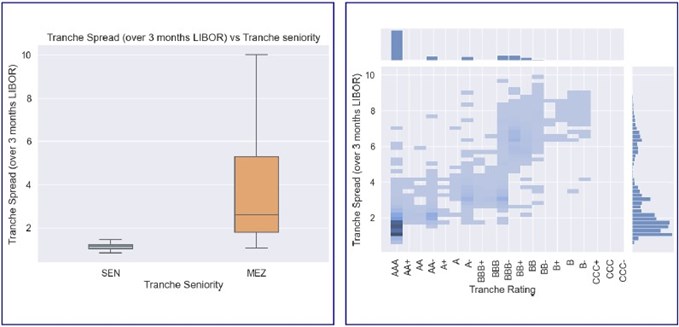

The mean, 25th, 50th, and 75th percentiles of the available spread (over 3 months LIBOR) of each rating category (includes +/-) can be found in the table above.
II-D. Egan-Jones Ratings vs Other Agencies
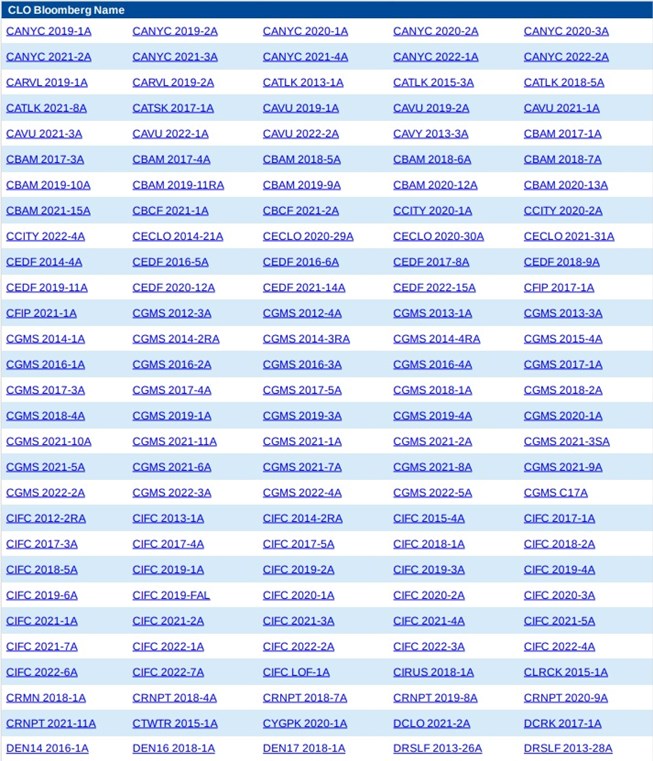
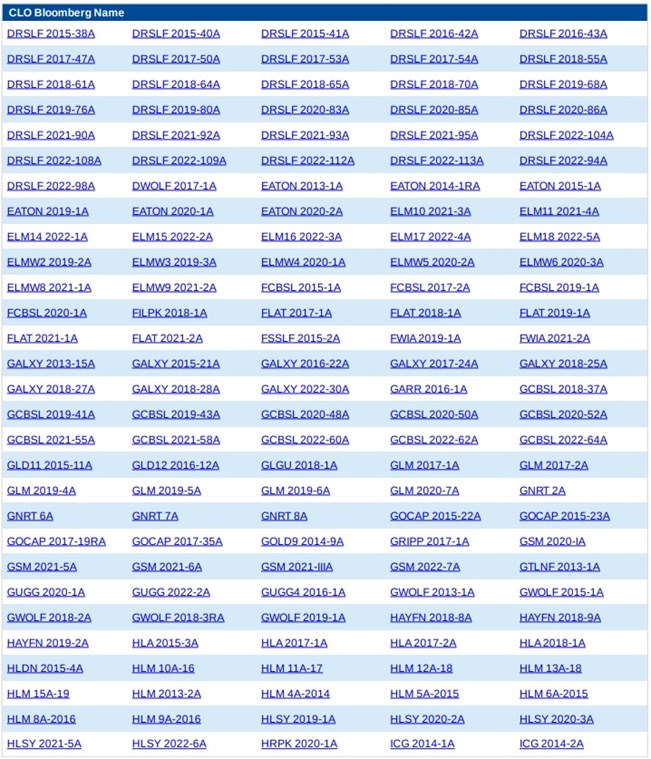
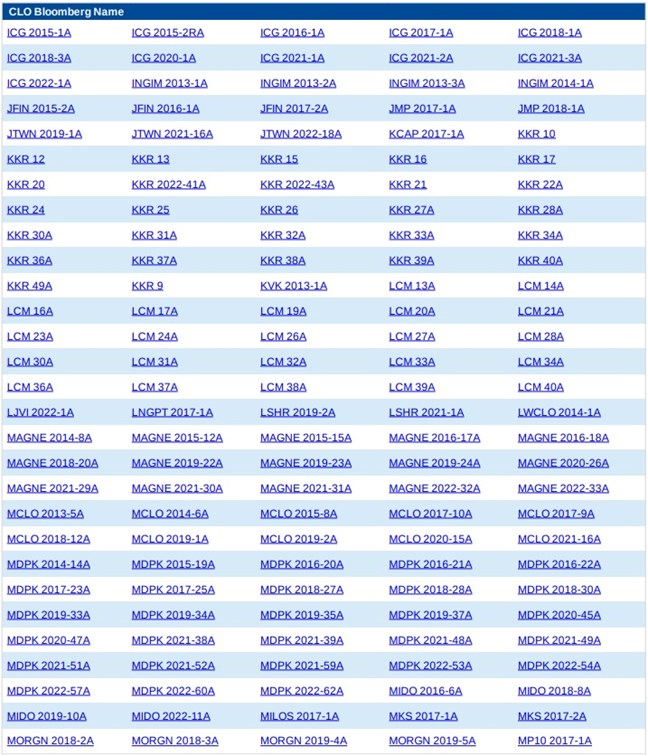
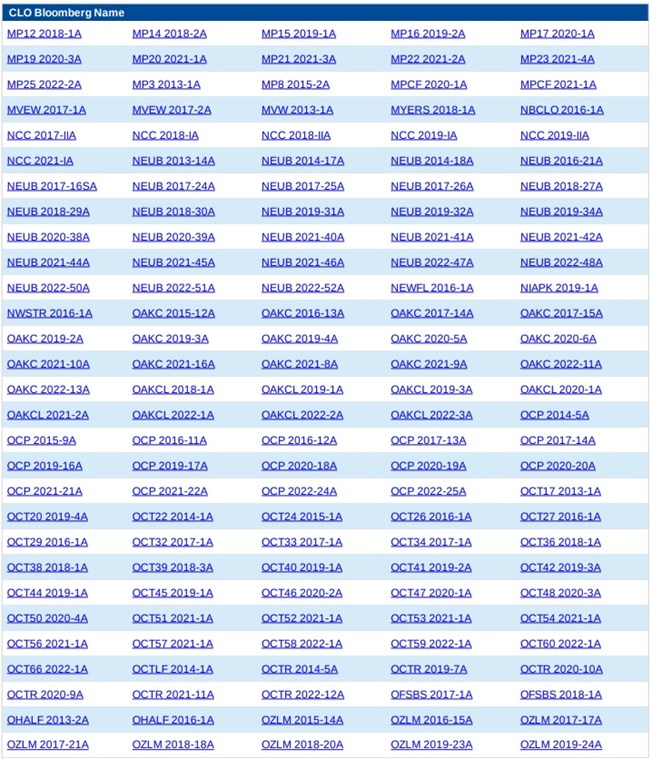
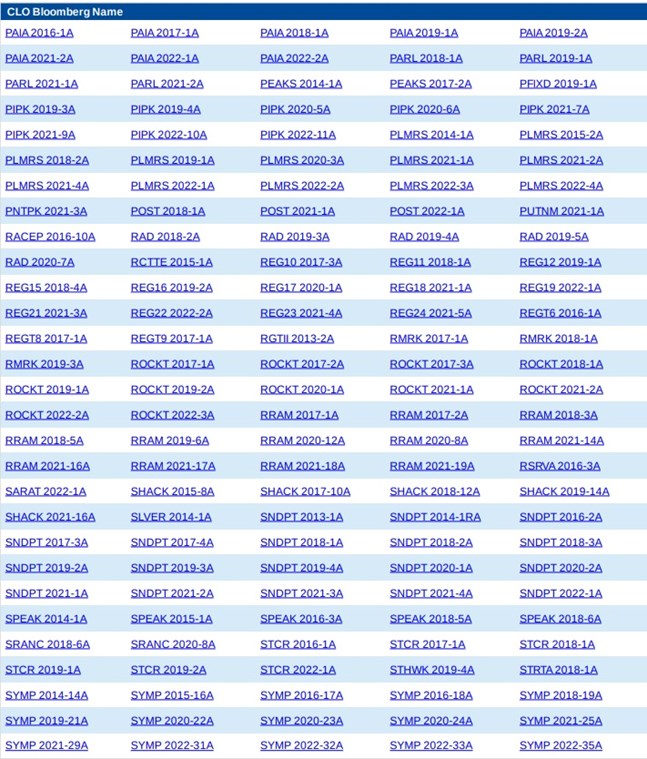
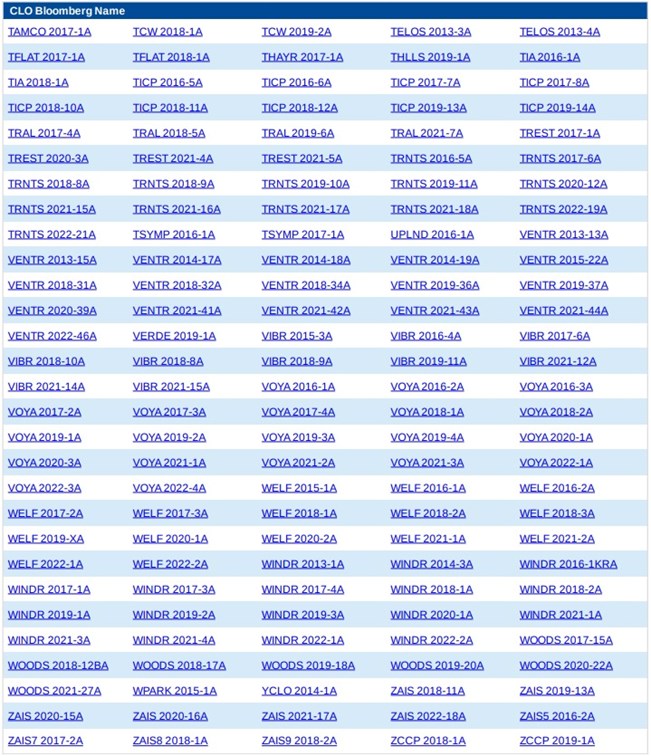
Below is a summary of Egan-Jones ratings compared with other agencies. For the detailed full listing and sorting of Egan-Jones’s CLO ratings, please visit our website at https://portal.egan-jones.com/client/fast/clo.aspx.
Egan-Jones's Key Rating Features & Differences Compared With Others
Below is a summary of Egan-Jones's approach (see our Methodology for a more complete description):
1. Our rating is derived from estimated losses.
2. The probabilities of default utilized are generally more conservative than industry standards.
3. Generally, our ratings are more heavily model driven and take into account fewer subjective assumptions.
4. Generally, we updates the cashflow and ratings monthly based on the availability of the trustee reports.
5. Our analysis is conducted using information and cash flow engines supplied by a recognized industry provider.
III. Pool Asset Key Metrics Summary
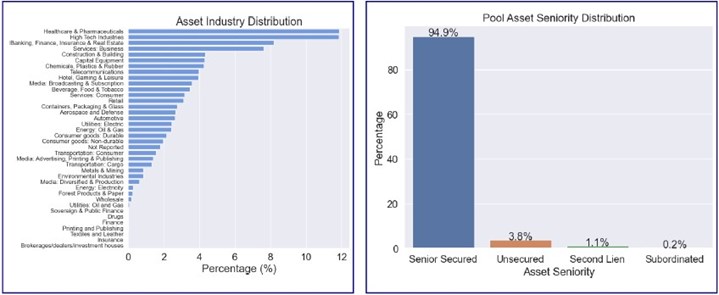
This section summarizes the characteristics of the underlying loans in the CLO deals.
III-A. Asset Distribution
III-B. Asset Coupon Analysis
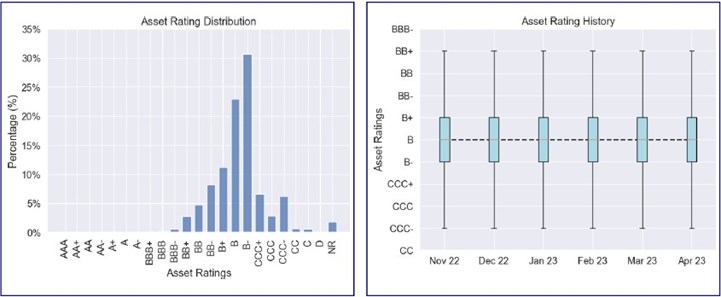
III-C. Asset Rating Analysis
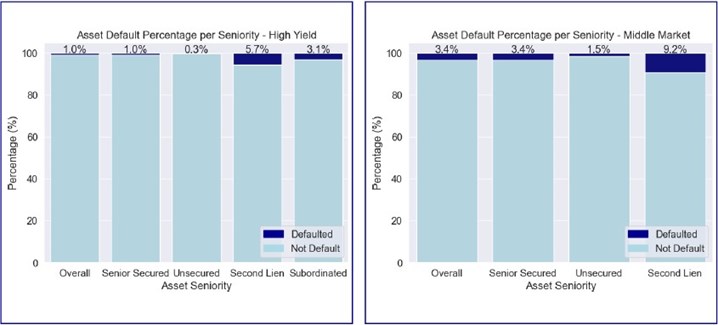
III-D. Asset Default Analysis
Notes
- US 2023 LL, HY Default Forecast Lifted by Growing Macro Headwinds
- Adj asset coupon means gross asset coupon minus the asset estimated losses which is assumed 50% of loss given default.
- Weighted Average Rating Score is derived from 10-year default rate and used to calculate the weighted average default probability of the portfolio.
- Diversity Score represents the number of independent, identical assets that we can use to mimic the default distribution of the actual portfolio.
- Tranches Subordination stands for the percentage of capital subordinated to the current tranche.
For more details, please refer to Egan-Jones's CLO methodology.
Disclaimer
The information in this report is based on current publicly available information that Egan-Jones considers reliable, but we do not represent it is accurate or complete, and it should not be relied on as such. The information, opinions, estimates, and forecasts contained herein are as of the date hereof and are subject to change without prior notification. Any credit ratings issued by Egan-Jones represent Egan-Jones’ current opinion of the credit risk of the instrument or entity rated. Any such credit ratings do not address other factors or risks such as market volatility, market risk or liquidity risk. Prospective clients should refer to Egan-Jones’ published statements as to the meaning of different credit ratings assigned by Egan-Jones. Credit ratings provided by Egan-Jones are solely intended to be used by institutional investors. Egan-Jones does not assess or address the suitability of any investment for any client or any other person or the marketability of any security or instrument. Any credit rating issued by Egan-Jones is not, and should not be construed as, a recommendation to buy, sell or hold any security or instrument or undertake any investment strategy and Egan-Jones does not act as a fiduciary for any person. Egan-Jones may raise, lower, suspend, withdraw, or otherwise modify a credit rating at any time in its sole discretion. EGAN-JONES IS NOT LICENSED AS A NATIONALLY- RECOGNIZED STATISTICAL RATING ORGANIZATION (“NRSRO”) IN RESPECT OF “ASSET-BACKED SECURITIES”, “GOVERNMENT SECURITIES”, “MUNICIPAL SECURITIES” OR SECURITIES ISSED BY A FOREIGN GOVERNMENT (ALL AS DEFINED IN THE FEDERAL SECURITIES LAWS AND, COLLECTIVELY, THE “EXCLUDED SECURITIES CATEGORIES”) AND ANY RATING ISSUED BY EGAN-JONES IN RESPECT OF ANY SECURITIES FALLING WITHIN AN EXCLUDED SECURITIES CATEGORY IS NOT ISSUED BY EGAN-JONES IN ITS CAPACITY AS AN NRSRO. Egan-Jones is not responsible for the content or operation of third-party websites accessed through hypertext or other computer links, cannot guarantee the accuracy of any information provided on an external website and shall have no liability to any person or entity for the use of, or the accuracy, legality, or content of, such third-party websites. The views attributed to any third party, including any article accessed via computer links, do not necessarily reflect those of, and are not an official view or endorsement of, Egan-Jones. This publication may not be reproduced, retransmitted, or distributed in any form without the prior written consent of Egan-Jones. © 2023, Egan-Jones Ratings Company. All rights reserved.
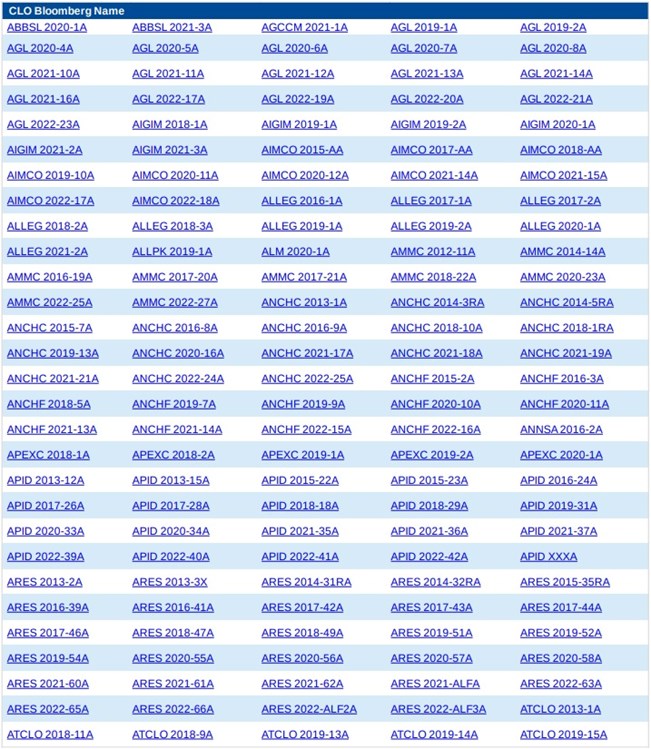
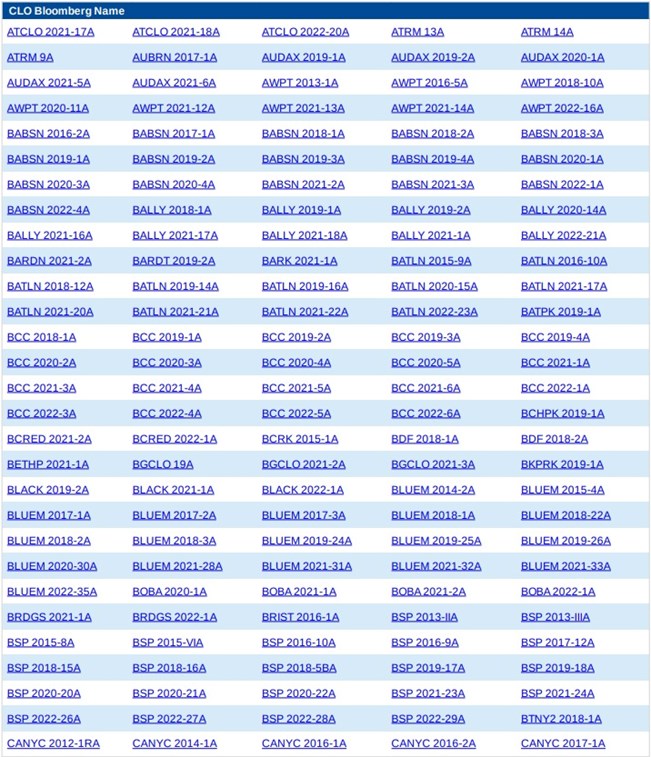
Appendix
How we can help
Egan-Jones Ratings Company started providing ratings in 1995 for the purpose of issuing timely, accurate ratings. Egan-Jones is a Nationally Recognized Statistical Rating Organization (NRSRO) and is recognized by the National Association of Insurance Commissioners (NAIC) as a Credit Rating Provider. Egan-Jones is certified by the European Securities and Markets Authority (ESMA) and recognized as market leader in Private Placement ratings. Egan-Jones also provides independent credit rating research, Climate Change / ESG scores, and Proxy research and recommendations.
Prospective clients have often asked how we can help them and what areas we consider are particularly strong. In response, below are the areas worth reviewing:
Private Placement Ratings – assisting investors access private markets via ratings on private placements.
Subscription Ratings – we have had a strong track record in providing early, accurate independent credit rating research.
Climate Change / ESG Scores – an assessment of entities’ current and prospective scores.
Independent Proxy Research and Recommendation/Voting – assisting fiduciaries in fulfilling their voting and record-keeping obligations.
Egan-Jones rates a wide variety of private placements:
Aircraft Lease and Loans
Airline Lease Back
Asset-backed loans
Bank, BDCs
Credit Facility/ Warehouses
Corporates
Credit-Tenant Loans (CTLs)
Equipment Leases
Financial Institutions
Ground Leases
Insurance
Middle Market Lending
Project Finance
Real Estate, REITs
Specialty Finance
CRE Loans, Other
Funds:
Closed-end Funds
Credit Funds
CRE Funds
Direct Lending Funds
Feeder Funds
Infrastructure Funds
Liquidity Funds
Mezzanine Funds
Mixed Strategy Funds
Opportunistic Funds
Real Estate Funds
Structured Debt Funds
Click here to view sample Private Placement transactions.


