Egan-Jones CLO* Summary Report (September 2024)
Egan-Jones CLO* Summary Report (September 2024)
*All Egan-Jones ratings in this report are non-NRSRO ratings
More Progress – The number of CLOs issued in August rose from 37 last year to 103 this year while the value rose from $13.7B to $44.1B (see Finsight.com). As can be seen from the chart below to the right, the asset yield was a bit below 9.0% while the weighted average tranche coupon was approximately 7.3%. Hence using the Adjusted Asset Coupon (i.e., including estimated losses) near 8.3%, the resulting pre-expense spread is near 10% for equity (i.e., 8.3% less 7.3% times 10 to reflect the leverage). Given that 10-year Treasuries are at 3.8%, the arbitrage has become more attractive on a relative basis. A chart to watch is II-A indicating improved tranche subordination.![]()
![]()

![]()
![]()
Currently, Egan-Jones tends to have a more positive view of CLO credit quality compared to other credit rating agencies, as demonstrated in the table below.

I. Deal Key Metrics Summary
As of August 2024, Egan-Jones rated 1474 CLO deals. We collected and calculated available deal level, tranche-level and asset-level key metrics such as deal weighted average rating factor and tranche subordinations, compared with prior period(s)’ analysis results and summarized highlights below.
I-A. Weighted Average Rating Score

Egan-Jones collected the weighted average rating score (WARS)³ of covered CLO deals. The 25th, 50th, and 75th percentiles of the WARS value were 3700, 3806, and 3948, respectively.
I-B. Diversity Score
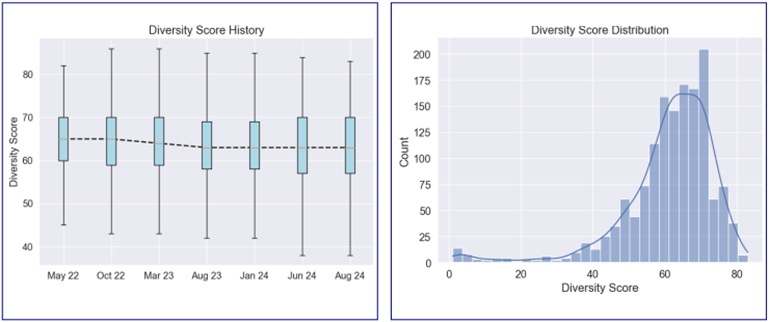
Egan-Jones collected the Diversity Score (DS)⁴ of covered CLO deals. The 25th, 50th, and 75th percentiles of the DS value were 57, 63, and 70, respectively. Egan-Jones calculated and compared the monthly average value of DS data from May 2022 to this month. The mean value of DS has decreased over the observed period indicating that the diversity level of the portfolios might be decreasing.
I-C. Super Senior Tranches Subordination

Egan-Jones collected the senior tranches subordination⁵ (%) (STS) of covered CLO deals. The 25th, 50th, and 75th percentiles of the STS value were 34.0, 35.8, and 38.6, respectively.
I-D. CCC+ or Lower Rating Percentage


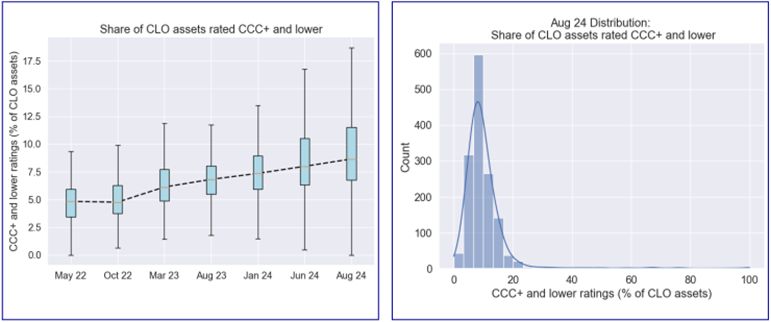
Egan-Jones collected the CCC+ and Lower Rated Asset Percentage (%) (CLRA) of covered CLO deals. The 25th, 50th, and 75th percentiles of the CLRA value were 6.8, 8.7, and 11.5, respectively. Egan-Jones calculated and compared the monthly average value of CLRA data from May 2022 to this month. The mean value of CLRA has increased over the observed period indicating that the percentage of lower-rated assets might be increasing.
I-E. CLO Leverage Summary

Note: Deal balance is the sum of the current balance of all deal tranches; debt balance is the sum of current balance of all debt tranches.
Egan-Jones reviewed various liability/asset metrics. The 25th, 50th, and 75th percentiles of the total deal balance to collateral balance (total current tranches balance / current collateral balance) were 92.0%, 97.0%, and 99.0%, respectively. The 25th, 50th, and 75th percentiles of the debt balance to collateral balance (current non-equity tranches balance / current collateral balance) were 104.0%, 108.0%, and 109.0%, respectively.
II. Tranche Key Metrics Summary
II-A. Tranche Subordination Analysis

The average subordination levels (defaulted assets are valued at market value) of senior tranches and mezzanine tranches were 38.4% and 15.2%, respectively. The 25th, 50th, and 75th percentiles of senior tranche subordination levels (defaulted assets are valued at market value) were 34.0%, 35.8%, and 38.5%, respectively. The 25th, 50th, and 75th percentiles of mezzanine tranche subordination levels (defaulted assets are valued at market value) were 7.6%, 14.3%, and 21.4%, respectively.


The mean, 25th, 50th, and 75th percentiles of the available subordination of each rating category (includes +/-) can be found in the table above.
II-B. Tranche Coupon Analysis

The average coupon of senior tranches and mezzanine tranches are 6.5% and 8.8%, respectively. The 25th, 50th, and 75th percentiles of senior tranche coupon are 6.6%, 6.7%, and 6.8%, respectively. The 25th, 50th, and 75th percentiles of mezzanine tranche coupon are 7.3%, 8.2%, and 10.6%, respectively.


The mean, 25th, 50th, and 75th percentiles of the available coupon of each rating category (includes +/-) can be found in the table above.
II-C. Tranche Spread Analysis
The average spread (over 3 months SOFR) of senior tranches and mezzanine tranches are 1.5% and 3.8%, respectively. The 25th, 50th, and 75th percentiles of senior tranche spread (over 3 months SOFR) are 1.3%, 1.4%, and 1.5%, respectively. The 25th, 50th, and 75th percentiles of mezzanine tranche spread (over 3 months SOFR) are 2.1%, 3.1%, and 5.8%, respectively.


The mean, 25th, 50th, and 75th percentiles of the available spread (over 3 months SOFR) of each rating category(includes +/-) can be found in the table above.
II-D. Egan-Jones Ratings vs Other Agencies
Below is a summary of Egan-Jones ratings compared with other agencies. For the detailed full listing and sorting of Egan-Jones’s CLO ratings, please visit our website at https://portal.egan-jones.com/client/fast/clo.aspx.

Egan-Jones's Key Rating Features & Differences Compared With Others
Below is a summary of Egan-Jones's approach (see our Methodology for a more complete description):
1. Our rating is derived from estimated losses.
2. The probabilities of default utilized are generally more conservative than industry standards.
3. Generally, our ratings are more heavily model driven and take into account fewer subjective assumptions.
4. Generally, we update the cashflow and ratings monthly based on the availability of the trustee reports.
5. Our analysis is conducted using information and cash flow engines supplied by a recognized industry provider.
6. For some transactions, when senior tranches are being paid down/off, our ratings on subordinated tranches generally move higher than the initial rating due to the improved tranche subordination and resulting in less estimated loss. To avoid confusion, we exclude from the chart above the impacted transactions. (AGCCM 2021-1A,AMMC 2016-18A, APID 2017-26A, AWPT 2018-9A, BABSN 2018-2A, BSP 2017-12A, CANYC 2012-1RA, CATSK2017-1A, CBAM 2017-1A, CGMS 2013-1A, CIFC 2014-2RA, CLRCK 2015-1A, CTWTR 2015-1A, DCRK 2017-1A,DRSLF 2017-47A, FLAT 2017-1A, FLAT 2018-1A, FSSLF 2015-2A, GLD11 2015-11A, GLM 2017-2A, GNRT 2A, HLA2015-3A, HLA 2017-1A, HLA 2017-2A, JMP 2017-1A, KKR 13, KKR 9, LCM 15A, LCM 38A, MP10 2017-1A, MVEW2017-1A, MVEW 2017-2A, OZLM 2017-17A, RAD 2018-2A, ROCKT 2017-2A, TFLAT 2017-1A, TICP 2018-10A,VENTR 2014-18A, VENTR 2017-27A, VIBR 2017-6A, VIBR 2017-7A, VOYA 2016-2A, WELF 2016-2A, WELF2017-2A, WELF 2018-2A, ZAIS 2021-17A, ZAIS7 2017-2A, ZCCP 2018-1A)
III. Pool Asset Key Metrics Summary
This section summarizes the characteristics of the underlying loans in the CLO deals.
III-A. Asset Distribution

III-B. Asset Coupon Analysis


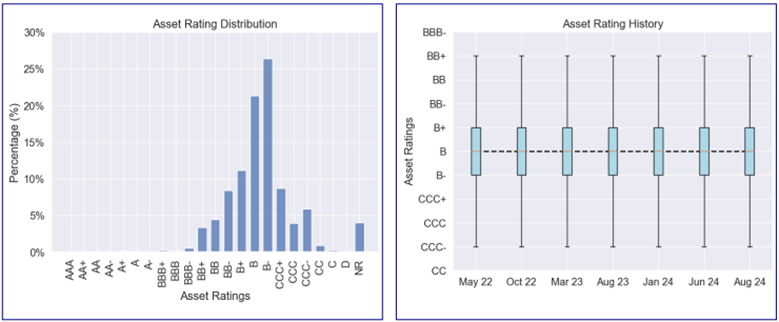
III-C. Asset Rating Analysis


III-D. Asset Default Analysis

Footnotes and sources
Adj asset coupon means gross asset coupon minus the asset estimated losses which is assumed 50% of loss given default.
Weighted Average Rating Score is derived from 10-year default rate and used to calculate the weighted average default probability of the portfolio.
Diversity Score represents the number of independent, identical assets that we can use to mimic the default distribution of the actual portfolio.
Tranches Subordination is calculated as (Collateral Value - (Pari-Passu Balance + Senior Balance)) / Collateral Value. Defaulted assets are valued at market value.
For more details, please refer to Egan-Jones's CLO methodology.


